pvigier's blog
computer science, programming and other ideas
Vagabond – Borders, Rivers, Cities and Roads

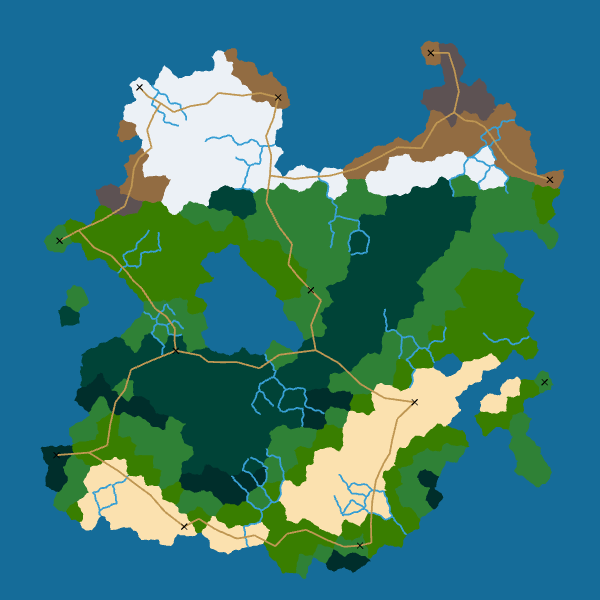
In this week’s devlog, I take up the map generator where I left it last week. I explain how I improved cell borders and added rivers, cities and roads to the map generator.
Vagabond – Map Generation

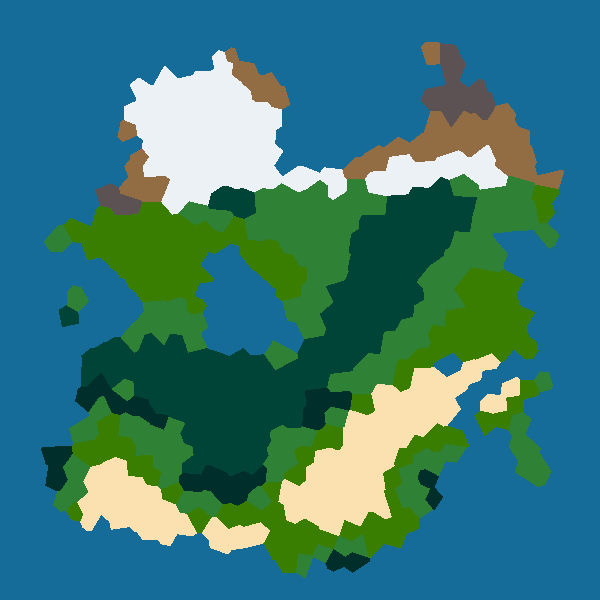
In this first devlog about Vagabond, I am going to talk about the map generation algorithm I have started to design. Indeed, in Vagabond all the maps will be procedurally generated.
Firstly, I will list some of the constraints that will influcence the design of the map generation pipeline:
- It must be fast as I do not want the player to wait for too long during map generation.
- It must not be totally random as Vagabond is a RPG, the world must be coherent.
- It must generate the entire map at once as different part of the world will interact.
- It must return a data structure easy to manipulate to be able to add more elements later such as rivers, cities, roads, dungeons, etc.
Commit Graph Drawing Algorithms

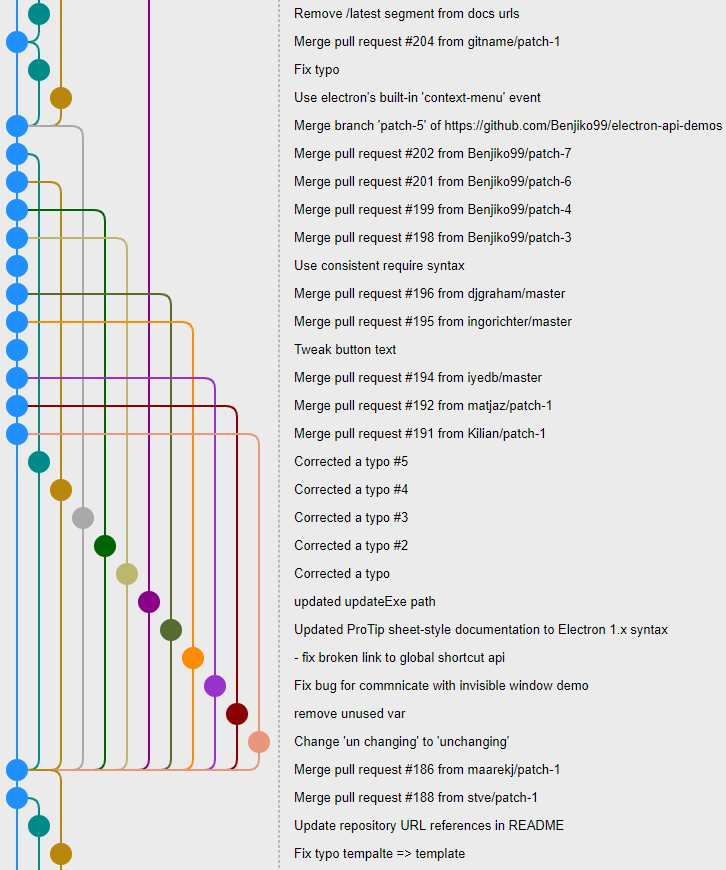
This article is one chapter of my master thesis entitled “Design and implementation of a graphical user interface for git”. It describes the algorithm I designed to draw the commit graph in my own prototype git client called gitamine. I have adapted the content so that it fits better with this blog.
Drawing graphs is a very complex topic in general but here we want to draw a specific type of graphs: commit graphs. Commit graphs have several several pieces of information that simplify the problem. The most important ones are that the graph is directed and acyclic and that the commits have timestamps.
Moreover, among the many ways we can draw a directed acyclic graph some are more appropriate for commit graphs. Indeed, programmers manipulate the branches of the graph thus it will be more convenient for them if the representation allows to visualize them easily.
We will first study the different types of graph drawing algorithms used in other clients. Then, we will describe how to place the nodes so that the commit graph is nicely drawable. Finally, we will cover some optimizations done in gitamine to draw and browse the graph in real time.
Simulopolis Is Dead
As some of you noticed, Simulopolis is not active since last November. I had still many ideas and many things to do before the game was finished. I started to work on the version 0.0.4 and even had some small features ready.
However, the internship and the master thesis (see next article) for more info) I was doing since September were not going well. Thus, I had to completely stop working on Simulopolis on my free time and work on my master thesis instead to have a little chance to see my thesis accepted by the jury. It was exhausting but eventually I succeeded!
My oral defense was in April so I did not work on Simulopolis for five months. Then, I had to take decisions concerning my future. I chose to leave Paris and to join my girlfriend in a smaller city in the center of France. Moreover, I decided that I did not want to work in a big company. Indeed, I am still young and relatively free from any constraint so I think it is the right moment in order to take my chance as an indie developer.
The bad news is, as you have guessed with the title, that I am not going to resume the development of Simulopolis. But the good news is that I have already started to work on a new project. It is called Vagabond (the name can still change). I will try to blog as much as possible about it so stay tuned! :)
Tags: simulopolis
Fortune's Algorithm: The Details
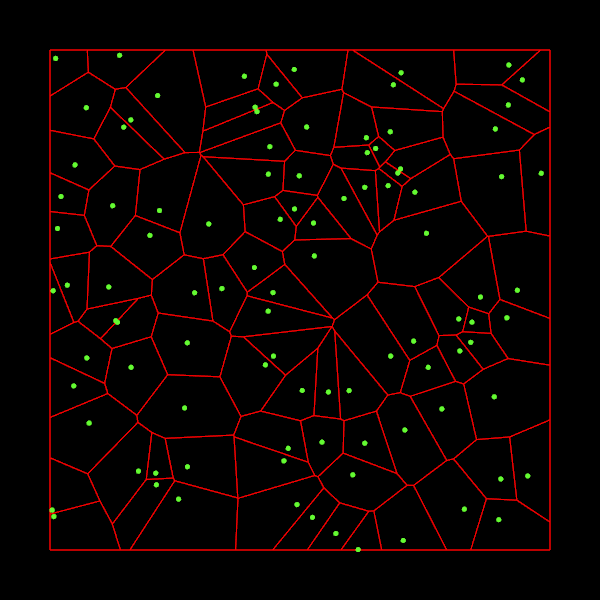
The last few weeks, I worked on an implementation of the Fortune’s algorithm in C++. This algorithm takes a set of 2D points and construct the Voronoi diagram of these points. If you wonder what is a Voronoi diagram, it looks like this:

For each input point, which is called a site, we want to find the set of points which are nearer to this site than to any other site. These sets of points form cells as you can see on the image above.
What is remarkable about the Fortune’s algorithm is that it constructs such diagrams in \(O(n\log n)\) time (which is optimal for an algorithm which uses comparisons) where \(n\) is the number of sites.
I am writing this article because I find it very hard to implement this algorithm. Until now, it is surely the hardest algorithm I have ever implemented. Thus, I want to share with you the issues I faced and how I solved them.
The code is, as usual, available on github and you will find all the references I used at the bottom of this article.
